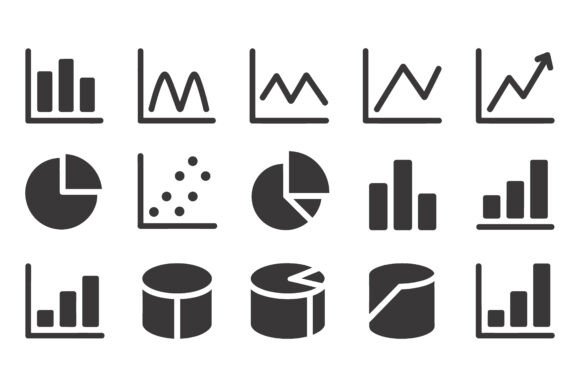
Business Data Analytics Icon SVG Bundle: A Practical Resource for Visual Communication
When building dashboards, presentations, reports, or internal documentation, clarity matters. Icons serve as visual shorthand—helping users grasp concepts like data flow, growth metrics, statistical analysis, or chart types at a glance. The Business Data Analytics Icon SVG Bundle is a curated collection designed specifically for professionals who regularly work with data-driven narratives. It includes scalable vector graphics (SVG) representing core analytics concepts: pie charts, bar graphs, line trends, growth arrows, database nodes, heatmaps, funnel stages, and more—all unified by a clean, modern aesthetic.
What Sets This Bundle Apart?
Unlike generic icon sets that cover broad categories (e.g., “business” or “technology”), the Business Data Analytics Icon SVG Bundle focuses narrowly on data visualization and analytical workflows. Each icon is purpose-built—not repurposed from broader libraries—and reflects functional accuracy. For example, a “correlation matrix” icon doesn’t mimic a generic grid; it uses subtle color gradients and labeled axes to suggest bivariate analysis. Similarly, the “data pipeline” icon shows layered components (ETL, staging, warehouse, BI layer) rather than a vague arrow sequence.
The bundle also prioritizes technical flexibility. Every icon is delivered in six formats: SVG (scalable, code-friendly), PDF (print-ready), JPEG and PNG (raster options, including PNG with transparent background), EPS (legacy vector support), and AI (fully editable in Adobe Illustrator). That range supports diverse use cases—from embedding icons directly into HTML dashboards using inline SVG, to inserting high-res assets into printed strategy decks, or modifying colors and strokes in design software.
How It Compares to Alternatives
Many designers and analysts rely on free or subscription-based icon platforms (e.g., Flaticon, Noun Project, or Figma community libraries). These offer breadth but often lack domain specificity. Searching for “forecasting icon” may return weather symbols or abstract clocks—not time-series models or confidence intervals. In contrast, the Business Data Analytics Icon SVG Bundle assumes familiarity with analytics terminology and delivers icons aligned with real-world tools and concepts: cohort analysis, A/B test setups, outlier detection, or dashboard KPIs.
Compared to custom illustration services, this bundle offers immediacy and consistency. Hiring a designer for 50+ analytics-specific icons would cost several hundred dollars and require multiple rounds of revision to ensure visual cohesion. With the Business Data Analytics Icon SVG Bundle, users receive a unified style system—consistent stroke weight, corner radius, color palette (with optional monochrome variants), and proportional scaling—ready for immediate deployment.
It’s also distinct from chart-generation libraries (like Chart.js or Plotly), which produce dynamic, data-bound visuals. Those are essential for live reporting—but not for static explanatory diagrams, slide annotations, or UI labeling. Icons fill that gap: they communicate structure, process, or category—not real-time values.
Strengths and Practical Fit
The primary strength of the Business Data Analytics Icon SVG Bundle lies in its contextual precision. Consider these realistic scenarios:
- A data literacy trainer building a workshop deck on “Understanding Statistical Significance” uses the “hypothesis test” icon (showing null vs. alternative distributions) alongside plain-language explanations—making abstract theory visually anchored.
- A product manager documenting an analytics roadmap inserts the “data lake architecture” icon next to bullet points about ingestion layers and governance policies—improving stakeholder comprehension without requiring technical diagrams.
- A marketing analyst creating a client-facing report on campaign attribution uses the “multi-touch funnel” icon to label stages before diving into model outputs—reinforcing narrative flow before presenting numbers.
Because all files are editable (AI and EPS), users can adjust colors to match brand guidelines, simplify details for small UI sizes, or combine elements—for instance, overlaying a “growth arrow” on a “bar chart” icon to signal year-over-year improvement.
Tradeoffs and Limitations
This bundle isn’t intended for highly specialized or proprietary analytics methods. If your team uses niche modeling techniques—like Bayesian structural time series or SHAP value visualizations—the icons won’t reflect those exact implementations. They represent widely recognized patterns, not vendor-specific features.
Also, while the SVG format scales infinitely, raster versions (JPEG/PNG) have fixed resolutions. For large-format print (e.g., trade show banners), relying solely on PNG may result in pixelation—so SVG or PDF should be preferred when scalability matters.
Another consideration: the bundle doesn’t include animated or interactive variants. If you need hover effects, loading states, or micro-interactions in web interfaces, you’d still need to build those separately—though the SVG source files make that development easier than starting from scratch.
When It’s the Right Choice
The Business Data Analytics Icon SVG Bundle fits best when you need:
- Consistency across multiple documents or teams: A shared icon language reduces ambiguity—especially useful for cross-functional projects involving analysts, engineers, and business stakeholders.
- Rapid prototyping or documentation: When deadlines are tight and visual fidelity matters, having pre-vetted, domain-relevant icons saves hours over searching, editing, or commissioning assets.
- Technical accuracy without complexity: Icons avoid oversimplification (e.g., no “magic wand” for machine learning) while remaining accessible to non-technical audiences.
- Format flexibility: Whether you’re pasting into PowerPoint, coding into React components, or prepping a PDF whitepaper, the included file types reduce conversion friction.
When You Might Choose Something Else
If your work demands highly customized visuals—such as icons tied to your company’s unique data taxonomy, proprietary tool interfaces, or industry-specific regulatory frameworks—a tailored illustration project may be more appropriate. Similarly, if you’re building a public-facing analytics application where icon semantics must pass strict accessibility audits (e.g., WCAG-compliant labels and contrast ratios), you’ll need to verify and potentially augment the provided assets.
For occasional, low-stakes use—like a one-off presentation slide—you might find free, CC-licensed icons sufficient. But repeated use across departments, clients, or deliverables increases the value of a cohesive, professionally curated set like the Business Data Analytics Icon SVG Bundle.
Making the Decision
Evaluating resources like this comes down to balancing time, accuracy, scalability, and reuse potential. Ask yourself:
- How often do I explain analytics concepts visually—and how much time do I currently spend sourcing or adapting icons?
- Do my current assets reflect actual analytics workflows, or are they generic placeholders?
- Do I need versions that work across print, web, and design tools—or am I limited to one environment?
- Is consistency across my team’s materials important enough to justify a small upfront investment?
There’s no universal answer—but for analysts, data scientists, BI developers, and communications professionals who regularly translate complex data ideas into clear visuals, the Business Data Analytics Icon SVG Bundle serves as a practical, reusable foundation—not a one-size-fits-all solution, but a well-considered tool for a specific, recurring need.